Model Of Efficiency?
Comparing Barkley To NFL RBs
Howie Roseman did the unthinkable. He signed former Giants running back Saquon Barkley to a three-year, $37.75 deal, with an annual average of about $12.6 million.
Barkley’s new contract represents roughly 5% of the total cap expenditure of 2024 ($255.4 million) at the running back position. For reference, in 2023, the Eagles spent around $5.5 million total on their running back room, slightly less than 2.5% of the total cap expenditure.

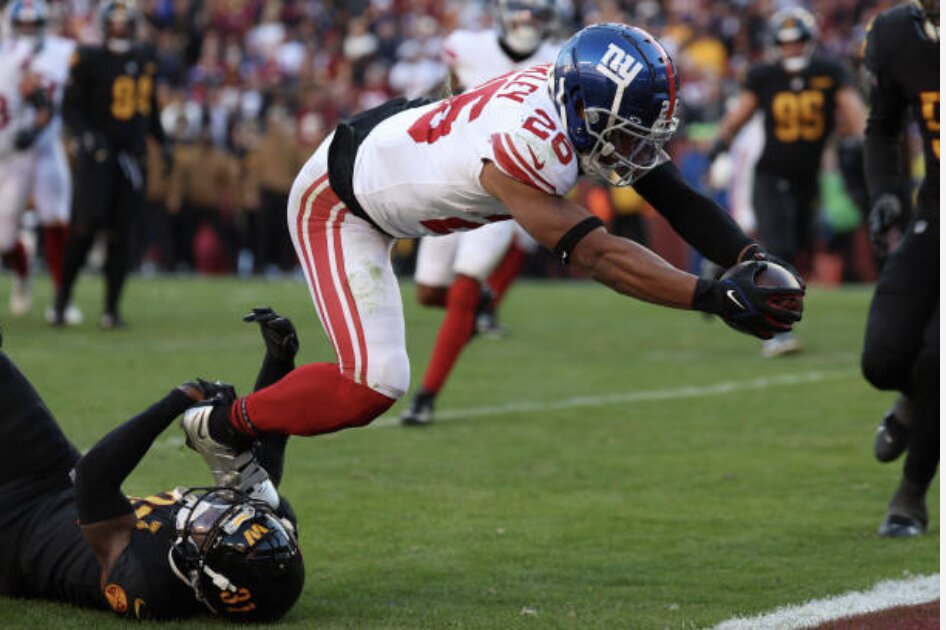
GETTY IMAGES: Can Saquon Barkley be a more efficient running back in the Eagles’ offense?
Is it justified to spend more than double on just one player?
This analysis will break down the state of running backs in the NFL, in a similar fashion to the D’Andre Swift analysis following last year’s draft-weekend trade, and compare Barkley’s production and efficiency compared to league running backs.
Let’s first look at how Barkley performed during the last three seasons:
 Barkley’s best season of the last three years was 2022, in terms of rushing (295 carries for 1,312 yards, 10 touchdowns, and 4.45 yards per attempt). However, he showed his receiving prowess in 2023 by logging 41 receptions for 280 yards (6.83 yards per reception) and four receiving touchdowns.
The Eagles hope to get the best of both worlds, especially considering the hefty financial investment and the fact that Barkley will play with the best offense of his career.
Here’s a look at how Barkley compares to the NFL in his career so far:*

*For rushing statistics, RBs needed at least 75 rushing attempts. For receiving statistics, RBs needed at least 20 receptions.
Barkley averaged significantly more attempts and yards than an average NFL running back over the last three seasons. But his efficiency in terms of yards per attempt and yards per reception were below average.
This can possibly be explained by Barkley’s high volume of opportunities. It can also be attributed to the fact that the Giants’ offense has struggled significantly throughout the last three seasons.
Z-Score Explained:
Z-Scores standardize how far a value is from the average. A “Z-Score” can be a positive number, which indicates that a value is greater than the average, or a negative number, which indicates that a value is less than the average.
Z-Scores that are greater than 1 or less than -1 are statistically significant as they are outlier values.
For example, Colts running back Jonathan Taylor’s 18 rushing touchdown performance in 2021 would have a Z-Score of 3.39, compared to the three-year average of 5.34 touchdowns. This performance is atypical within the 3-year average and is thus a significant outlier.
Conversely, the same would be true for a player that scored 0 touchdowns, like Miles Sanders in 2021, which would have the Z-Score of -1.42, which is also a statistical outlier.
Percentile Rank Explained:
Percentile ranks measure the data point relative to all other data points in the population. A percentile rank of .75 means that the value point is higher than 75% of all the other data points (top 25%). A percentile rank of .25 means the value point is only higher than 25% of all other data points (bottom 25%).

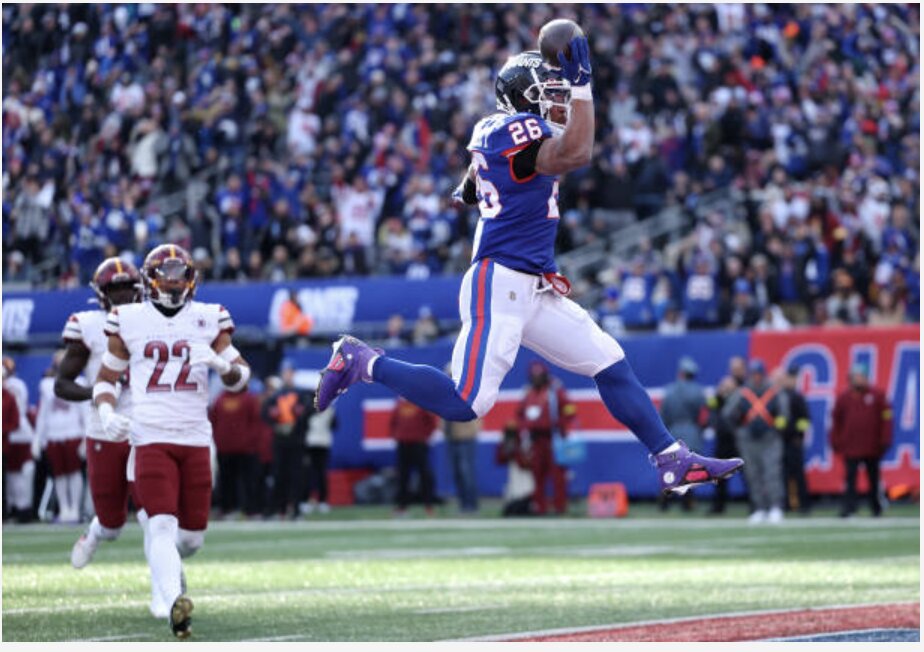
GETTY IMAGES: Saquon Barkley’s efficiency could improve merely by moving away from the Giants and into the Eagles’ offense.
Barkley Rushing Profile:
On average, Barkley has been above league average in attempts, yards, and touchdowns. His Z-Score for attempts was 1.01, for yards was 0.78, and for rushing touchdowns was 0.64.
Both yards and rushing touchdowns were within a normal amount above the mean. But his attempts were 1 complete standard deviation above the mean, meaning it’s significantly higher than average.
Barkley is also in the 85th percentile rank for attempts, 78th percentile rank for yards, and 64th percentile rank in touchdowns. That means in the past three years, on average, only 15% of running backs logged more attempts, 22% had more yards, and 36% had more touchdowns.
However, Barkley was largely inefficient in his high volume of touches. For instance, Barkley had a Z-Score of -0.45 in yards per touch, and was in the 33rd percentile rank. This means that roughly 66% of running backs were more efficient than Barkley.
This efficiency statistic should be concerning to the Eagles, but there are several explanations that could mitigate some concerns.
For instance, when high volume statistics are compared to low volume statistics, the actual results can be slightly skewed because a larger number of opportunities regress to the mean.
What this means is that with more opportunities, there are less anomalies – less skewed results. Running backs with less carries than Barkley have statistics that are more sensitive to extreme plays. If Barkley consistently puts up around 4.37 yards per attempt, he would have a similar output to D’Andre Swift (4.6 yards per attempt in 2023).
However, Barkley’s efficiency struggles can also be explained by the abysmal Giants offense for most of the last three seasons. The Eagles have had a top offense the past three seasons and would offer a major upgrade for Barkley’s big play ability.
Christian McCaffrey averaged 4.09 yards per attempt with the Panthers prior to joining the 49ers, and in his first full season with the 49ers, he put up 5.4 yards per attempt. A good player in a good offense with a better offensive line and other offensive threats should lead to more efficiency.
Eagles fans have also seen the inverse be true with Barkley’s old teammate at Penn State – Miles Sanders, who averaged 5.16 yards per attempt in his last three seasons with the Eagles, and after moving to the Panthers in free agency regressed to 3.3 yards per attempt.
Overall, the talent and ability to generate big plays in the rushing game will make Barkley another home-run threat for the Eagles, and his efficiency should only improve.

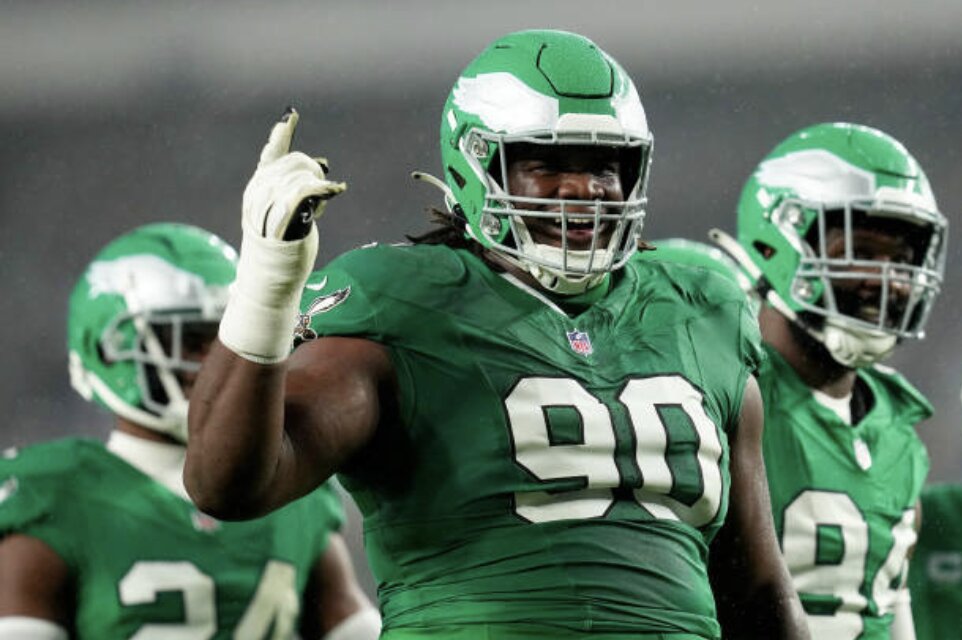
GETTY IMAGES: Saquon Barkley should see more volume as a pass-catcher than past Eagles RBs.
Barkley Receiving Profile
Barkley’s receptions had a Z-Score of 0.51, his receiving yards had a Z-Score of 0.10, and his receiving touchdowns had a Z-Score of 0.25. Barkley was in the 74th percentile rank in terms of receptions and 61st percentile rank for both receiving yards and receptions.
This means over the past three seasons, only 26% of running backs had more receptions and 39% of running backs had more receiving yards and more receiving touchdowns.
Barkley’s efficiency is another concern in the receiving game as he had a Z-Score of -0.59 and was in the 35th percentile rank. This means 65% of running backs were more efficient than Barkley in the last 3 seasons.
Again, the efficiency concerns are real, but can be mitigated by the same explanations as above. Additionally, his efficiency should improve in the Eagles’ offense in 2024 and beyond. The Eagles will likely rely on Barkley in the pass game more than they relied on Swift and Sanders.
In Kellen Moore’s scheme the top receiving running back averaged 7.99 yards per reception and two touchdowns over the last three seasons (Austin Ekeler, Tony Pollard, and Ezekiel Elliot, respectively).
These marks are higher than Barkley’s yards per reception of 7.29 and 1.57 touchdowns over the past three seasons.
Again, the talent difference alone between the Eagles’ and Giants’ offense is significant, but matched with the emphasis of Moore’s usage of running backs in the pass game, Eagles fans should be excited about Barkley’s potential within the new offense.
– Sam Finkel is a staff writer for InsideTheBirds.com who focuses on analytics.


Comments are closed here.