Not Your Average Running Back
Analytics Study: New RB Swift Primed For More Usage, Breakout Season
Led by roster architect Howie Roseman, the Philadelphia Eagles made a slew of moves during the 2023 NFL Draft, selecting prospects who the Eagles hope will make an instant impact.
But their most significant addition on Day 3 wasn’t a draft pick. The trade for fourth-year running back D’Andre Swift, a 2020 second-round pick, brought the Philadelphia native back home and armed the team’s backfield with another dynamic standout.
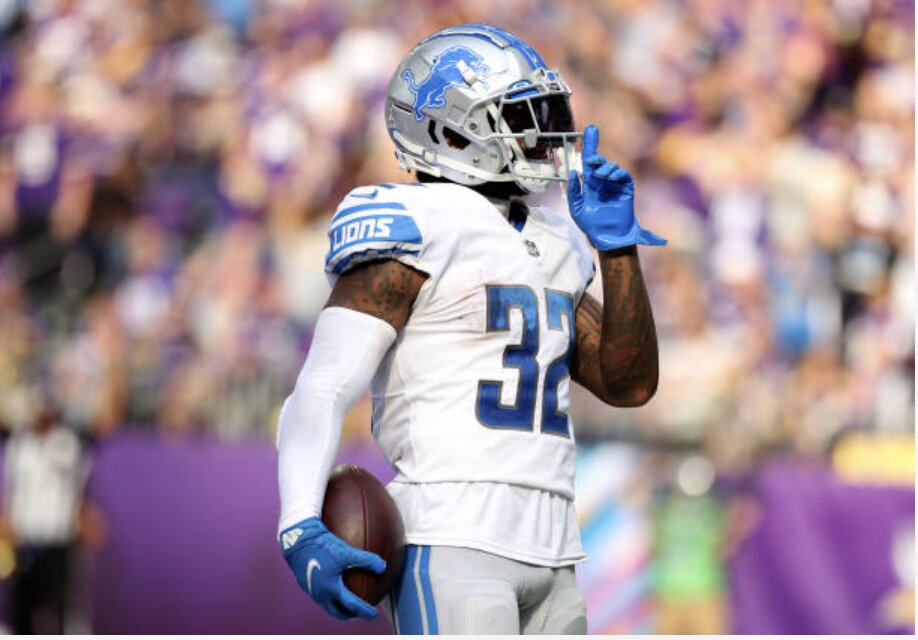
GETTY IMAGES: Data trajectory shows new Eagles RB D’Andre Swift is poised for a breakout if used more.
Swift might have enjoyed his best season in 2021 in terms of opportunities (151 carries/62 receptions) and yards (1,069 yards from scrimmage) but he was most efficient in 2022, averaging almost 5.5 yards per attempt while paired with Jamaal Williams, a more physical ball-carrier who often was used in short yardage and goal-line situations.
The Eagles hope to continue that efficiency by pairing Swift with a complementary piece Rashaad Penny, who was signed in free agency earlier this offseason, or in Trey Sermon, a 2021 third-round pick.
The chart below shows Swift, on average, compares to other NFL running backs in his career so far:*
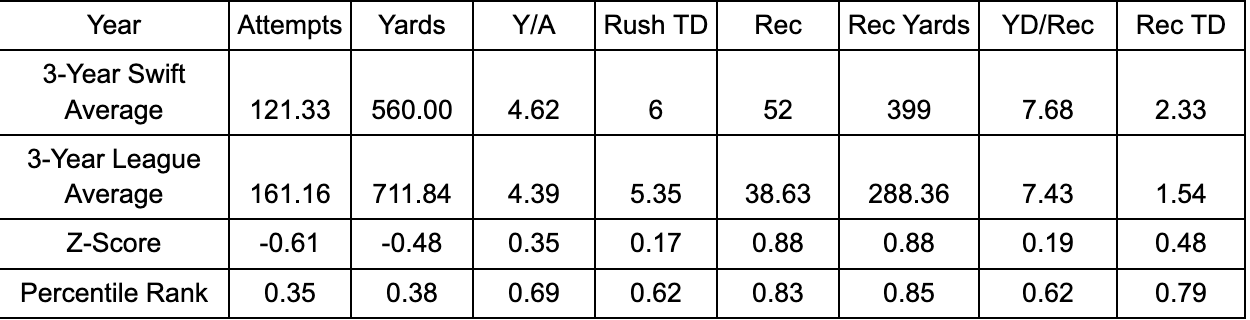
*For rushing statistics, RBs needed at least 75 rushing attempts and for receiving statistics at least 21 receptions. Both of these thresholds are 20% of the respective maximum values in the 3-year period.
Swift averaged less attempts and yards than the average NFL running back over the last three seasons, but averaged a better yards-per-attempt average, along with more rushing touchdowns, receptions, receiving yards, yards-per-reception average , and receiving touchdowns than the three-year league average.
Z-Score Explained:
Z-Scores standardize a value’s distance from the average. A positive Z-score indicates that a value is greater than the average, a negative Z-Score indicates that value is less than the average.
Z-Scores that are greater than 1 or less than -1 are statistically significant as they are outlier values.
For example, Derrick Henry’s 17 rushing touchdowns in 2020 would have a Z-Score of 3.09, compared to the 3-year league average of 3.77 touchdowns. This performance is atypical within the 3-year average and, therefore, a significant outlier.
The same is true for a player who scored no touchdowns, like Miles Sanders in 2021, which would have the Z-Score of -1.42, another statistical outlier.
Percentile Rank Explained:
Percentile ranks measure the data point relative to all other data points in the population. A percentile rank of .75, means the value point is higher than 75% of all the other data points (top 25%). A percentile rank of .25, on the other hand, means the value point is only higher than 25% of all other data points (bottom 25%).
Swift Rushing Profile:
On average, Swift has fallen below league average on attempts and yards. His Z-Score for attempts was -0.61 and -0.48 for yards. This show he’s within a normal amount below the mean – not an outlier.
Swift is also in the 35th percentile rank and 38th percentile rank, respectively, for attempts and yards. In the past three years, on average, 65% of running backs had more attempts than Swift and 62% of running backs gained more yards. This 3% difference is showcased in his efficiency statistics.
For instance, Swift’s efficiency (measured by yards per attempt) has a Z-Score of 0.35 and is in the 69th percentile rank. This means Swift is in the top 31% of running backs in efficiency, despite 65% of running backs having more opportunities.
This efficiency statistic projects that if the Eagles give Swift more opportunities than he had in Detroit, he would likely have a career season in 2023.
Finally, Swift’s rushing touchdowns have a Z-Score of 0.17, which is close to the average. However, his percentile rank is 62nd. This means that he’s in the top 38% of running backs in the last three seasons for touchdowns – another statistic that should increase, assuming his usage increases.
Swift Receiving Profile:
Swift’s receptions and receiving yards both have a Z-Score of 0.88, which is close to being significant.
His receptions are the 83rd percentile rank, which means he is in the top 17% of running backs over the last three seasons. His receiving yards are the 85th percentile rank, which means he is in the top 15% of running backs over the last three seasons.
Swift’s efficiency was only slightly above average within the last three seasons, with a Z-Score of 0.19 and in the 62nd percentile. This means that Swift is in the top 38% of running backs in terms of receiving efficiency.
Finally, Swift’s receiving touchdowns have a Z-Score of 0.48 and are within the 79th percentile, placing him in the top 21% of running backs in terms of receiving touchdowns.
Overall, Swift’s receiving upside will add a completely different dynamic to an Eagles offense that last year lacked the same trait.
– Sam Finkel is a staff writer for InsideTheBirds.com who focuses on analytics.
Listen to the latest “Inside The Birds” podcast featuring Adam Caplan and Geoff Mosher:
Or watch on YouTube:


Comments are closed here.